Monitoring
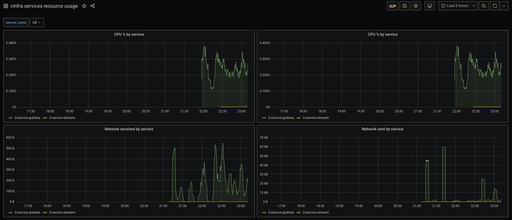
VInfra exposes service metrics for resource usage through a Prometheus API-compatible endpoint. This means you can connect your preffered monitoring tools to it and check how your services are running.
Grafana
You can connect VInfra metrics to your Grafana instance by adding it as a Prometheus Data Source.
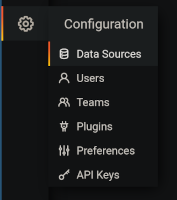
First, go to the Data Sources settings page. You can get there by clicking on
the Data Sources option in the Configuration (gear) menu.
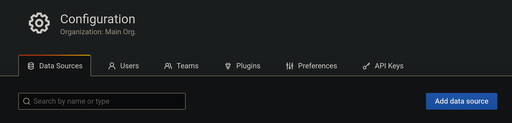
Then, click on Add data source
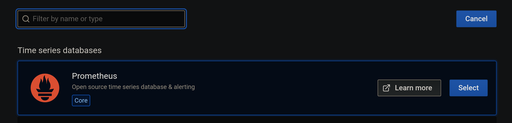
and select Prometheus from the list.
Now we are going to configure the data source.
First, give your data source a name (i.e. vinfra account {account_id}).
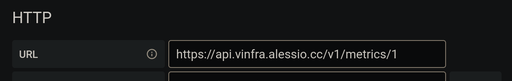
Then, set the URL of the data source to
https://api.vinfra.alessio.cc/v1/metrics/{account_id}, where {account_id}
is your VInfra account id number.
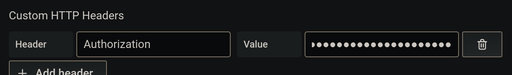
Next, add a HTTP header to authorize the access to your metrics. For this
you'll need a VInfra API token for an identity with permission to access your
metrics. The header's name is Authorization and the value is Bearer
{API_token}, where {API_token} is your VInfra API token.
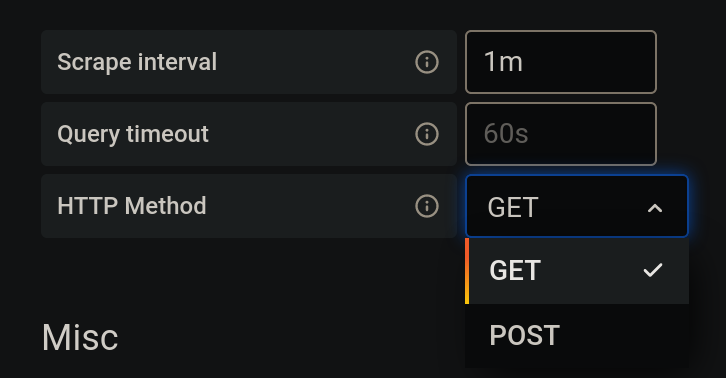
Following that, set scrape interval to 1m and the HTTP method to GET.
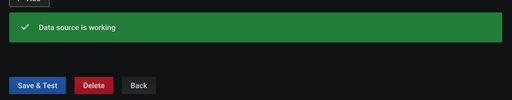
Finally, click on Save & Test. You should get a message with a green
background similar to the one in the image bellow.
You can now start monitoring your services by importing the Grafana dashboard found here.